
Bitcoin’s latest on-chain data suggests the market may be entering a phase where panic selling begins to fade, even as prices remain under pressure.
According to research from K33 Research, a significant portion of Bitcoin holders are now underwater, with more than half of the circulating supply having fallen into unrealized losses earlier this year. Historically, this level of financial stress has coincided with the final stages of previous bear markets, when long-term sellers gradually run out of coins to offload.
The milestone was reached on June 5, marking the first time during the current market cycle that Bitcoin’s supply in loss exceeded 50%. More than six weeks have now passed, placing the current downturn among the longest historical periods between that threshold and a confirmed market bottom.
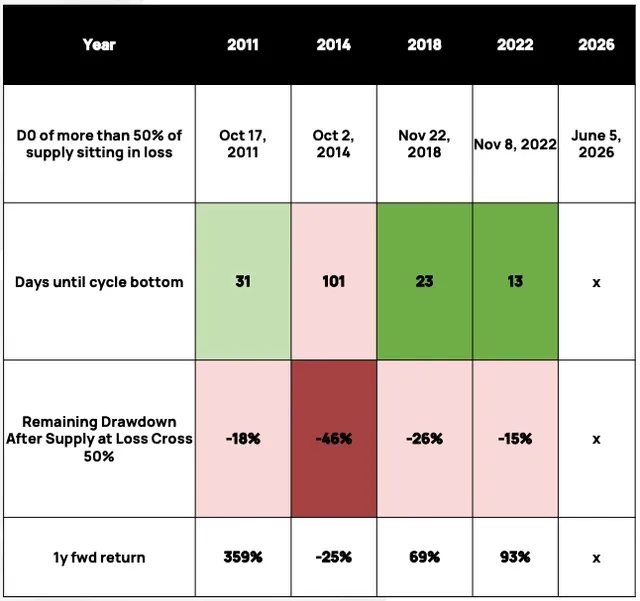
Previous cycles have followed a similar pattern. After more than half of Bitcoin’s supply slipped below cost basis, the market eventually bottomed within 13 days in 2022, 23 days in 2018, and 101 days during the 2014 bear market. While history offers no guarantee, K33 notes that every previous occurrence ultimately preceded a recovery, with strong returns typically recorded over the following year.
Although Bitcoin has yet to establish a definitive bottom, the prolonged period of unrealized losses suggests the market is progressing through a familiar capitulation phase rather than entering uncharted territory.
Additional data from CryptoQuant reinforces that narrative from another perspective.
The firm’s Realized Cap Variance (RCV) model, which compares Bitcoin’s market valuation with investors’ aggregate cost basis, has fallen into one of the weakest readings ever recorded. The indicator currently sits within the lowest 6% of its historical range, signaling that much of the speculative premium accumulated during previous rallies has already been erased.
Rather than focusing on price action alone, the model measures how investor capital is distributed throughout the network. Deeply negative readings indicate that market participants are holding coins far below their acquisition costs, a condition that has repeatedly appeared near major cycle lows.
CryptoQuant analyst Crazzyblockk noted that the standardized RCV Z-score has declined to -2.35, a level previously associated with the late stages of Bitcoin bear markets. Similar readings occurred before the market recoveries following the 2015, 2018 and 2022 downturns.
The most extreme signal in the indicator’s history appeared in November 2018, when the Z-score plunged to -4.68, almost perfectly coinciding with Bitcoin’s cycle low near $3,800.
While macroeconomic uncertainty and short-term volatility continue to weigh on sentiment, the combination of widespread unrealized losses and compressed investor cost-basis metrics suggests that the market may be transitioning from panic-driven selling toward a period of long-term accumulation. For investors watching on-chain data, the current environment resembles previous stages where fear dominated headlines just before Bitcoin began building its next recovery.