
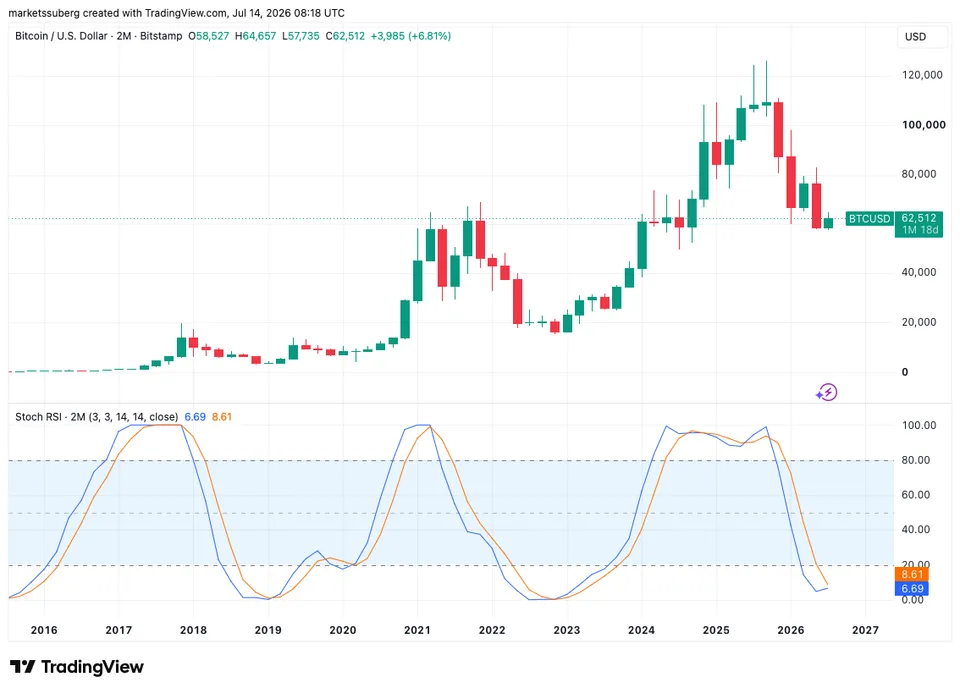
Bitcoin traders are once again looking to historical RSI patterns for clues about where the current bear market may end. But while several analysts expect the 2026 cycle to follow the same script as 2014, 2018, and 2022, a growing number of market observers argue that relying solely on historical momentum indicators could prove costly.
The reason is simple: Bitcoin has never traded through a market environment like the one it faces today.
History Doesn’t Always Repeat
Much of the bullish thesis centers on the two-month Stochastic RSI, which has historically reached zero near every major Bitcoin bear-market bottom.
While the pattern has been remarkably consistent across previous cycles, technical indicators are descriptive—not predictive.
In past bear markets, Bitcoin was largely driven by retail investors and crypto-native capital. Today, the asset trades in a vastly different environment shaped by institutional participation, spot ETFs, algorithmic trading, sovereign accumulation, and macroeconomic policy.
These structural changes could alter how momentum indicators behave compared with previous cycles.
Momentum Can Stay Weak Longer Than Expected
One common misconception among traders is that an oversold RSI automatically signals an imminent reversal.
In reality, strong downtrends can keep RSI pinned in oversold territory for extended periods.
Several traditional financial assets have remained oversold for months during major bear markets before eventually establishing a durable bottom. Bitcoin itself experienced similar behavior during previous cycles, where early buyers were forced to endure multiple waves of capitulation before the market stabilized.
That means a low Stochastic RSI alone may not be sufficient evidence that Bitcoin has reached its ultimate cycle low.
Fundamentals May Matter More Than Technicals
Unlike previous cycles, Bitcoin’s next major move could be driven less by technical indicators and more by macroeconomic developments.
Interest rate expectations, global liquidity, ETF inflows, institutional allocation, mining economics, and regulatory policy now have a far greater influence on Bitcoin’s price than they did five or ten years ago.
If liquidity conditions improve, Bitcoin could recover well before long-term RSI indicators complete their traditional cycle.
Conversely, if financial conditions tighten further, even historically reliable technical signals may fail to produce an immediate recovery.
Bullish Divergences Are Encouraging—But Not Confirmation
Bitcoin’s recent rally above $64,000 followed several bullish RSI divergences across multiple timeframes, suggesting selling pressure had begun to weaken.
However, bullish divergence typically marks a slowdown in bearish momentum rather than a guaranteed trend reversal.
Many bear markets experience powerful relief rallies before establishing lower lows, making divergence an early warning signal rather than definitive proof that the bottom is in.
For that reason, experienced traders often wait for confirmation through higher highs, improving market structure, or sustained institutional demand before declaring a new bull market.
Market Outlook
Bitcoin’s momentum indicators are undeniably becoming more constructive, and historical RSI patterns continue to attract attention from long-term traders. Yet the current cycle is unfolding in a fundamentally different market environment than any before it.
Rather than assuming history will repeat exactly, investors may benefit from viewing RSI as one piece of a broader puzzle alongside liquidity trends, ETF flows, macroeconomic conditions, and on-chain data.
If Bitcoin ultimately diverges from previous cycles, it would not necessarily invalidate RSI as a useful indicator—it would simply reflect the continued evolution of an asset that is becoming increasingly integrated into the global financial system.