
The Battle for $60,000 Intensifies
Bitcoin entered a critical phase on Friday after losing its grip on the psychologically important $60,000 level, raising concerns that a former support zone could soon become a major resistance barrier.
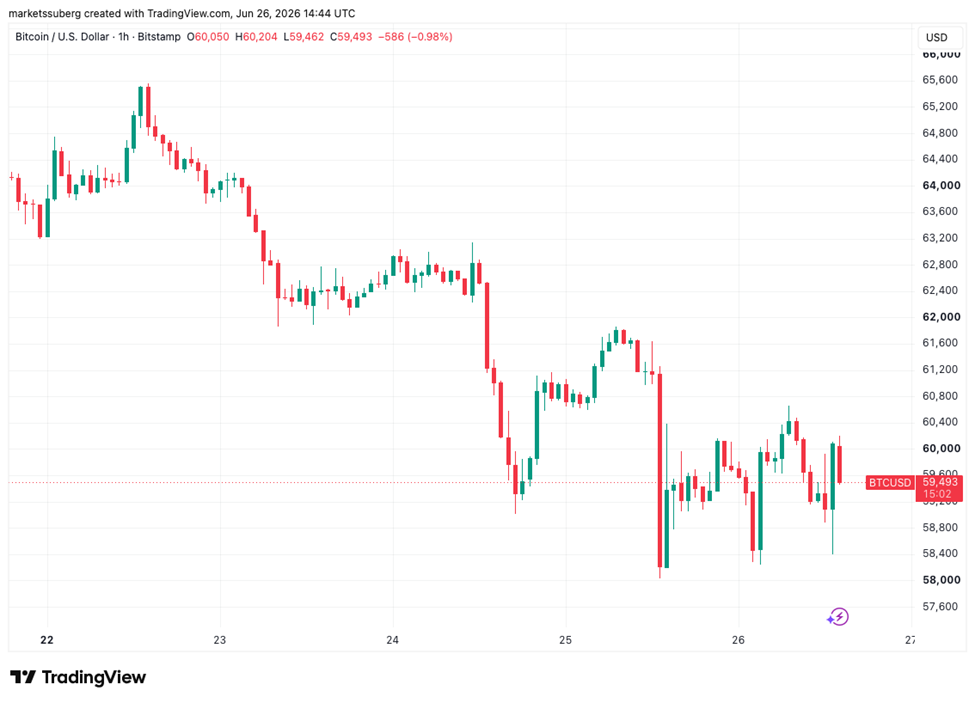
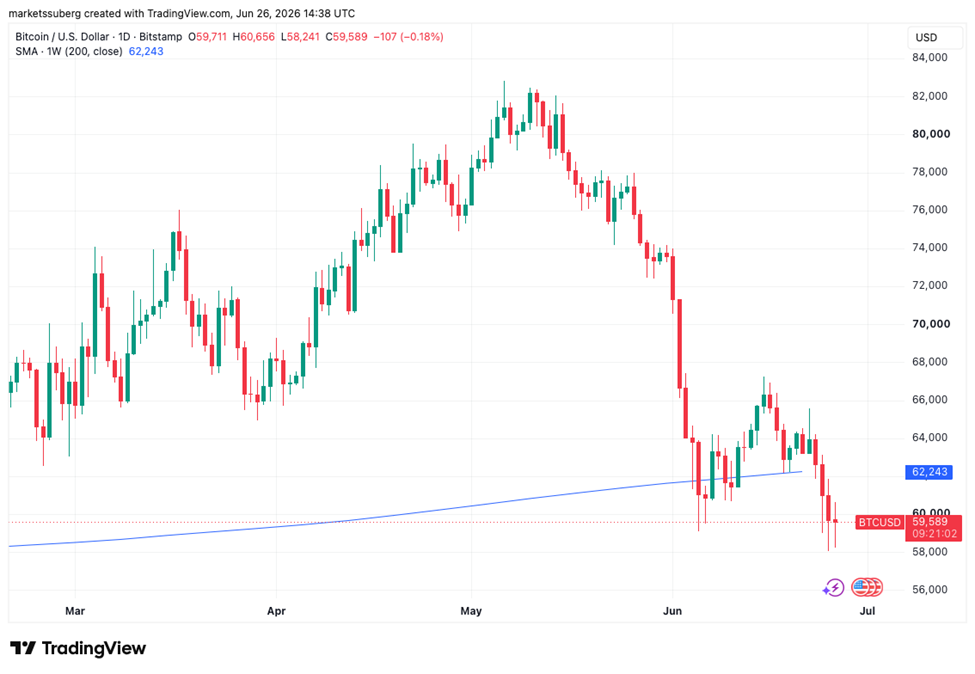
The flagship cryptocurrency recorded its first daily close below $60,000 since September 2024, a technical development that has prompted traders to reassess the strength of the current market structure. While the decline itself is noteworthy, the broader macroeconomic backdrop may be even more significant.
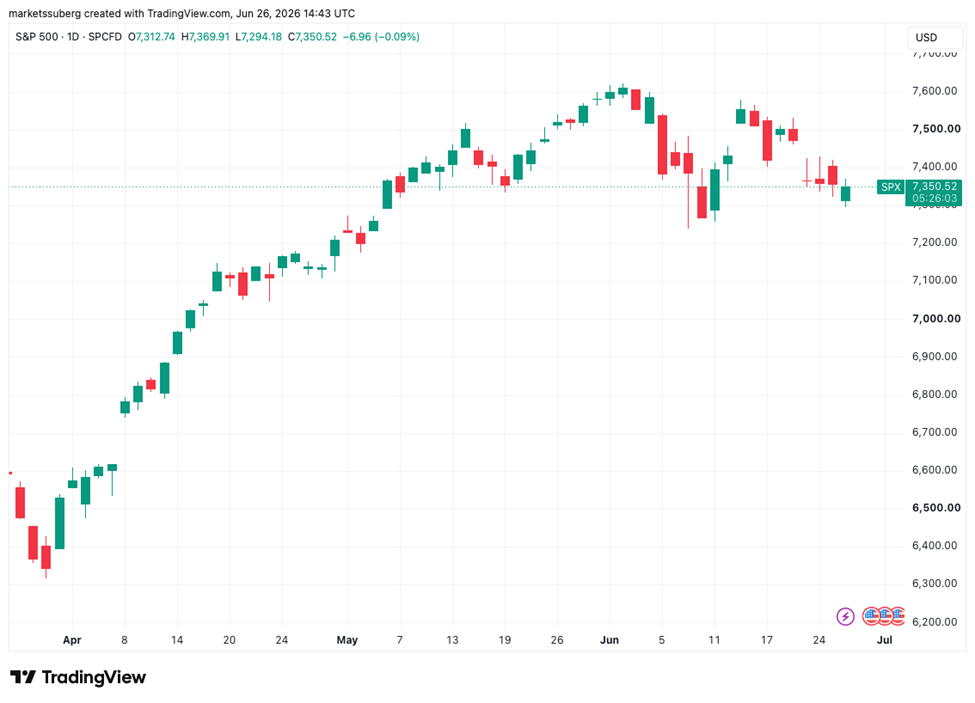
Unlike previous pullbacks that were largely crypto-specific, the current weakness is unfolding alongside a wider retreat across global risk assets, particularly technology stocks. This suggests Bitcoin is once again trading as a macro-sensitive asset rather than an isolated alternative investment.
Global Markets Signal Risk-Off Sentiment
Asian equity markets endured another turbulent session, with South Korean stocks suffering a sharp sell-off that triggered market-wide circuit breakers following an 8% plunge.
The decline reflects growing investor anxiety surrounding the technology sector, which has been one of the primary drivers of global market performance over the past several years. As valuations continue to compress, investors are increasingly reducing exposure to high-growth assets, a category that often includes cryptocurrencies.
While U.S. equities displayed greater resilience, the divergence may prove temporary. Historically, significant corrections in technology stocks tend to spill over into broader risk markets, and Bitcoin has rarely remained immune when global liquidity conditions tighten.
Market observers should remember that Bitcoin’s strongest rallies have often coincided with periods of abundant liquidity and aggressive risk-taking. The current environment presents the opposite dynamic.
Inflation Remains the Market’s Biggest Threat
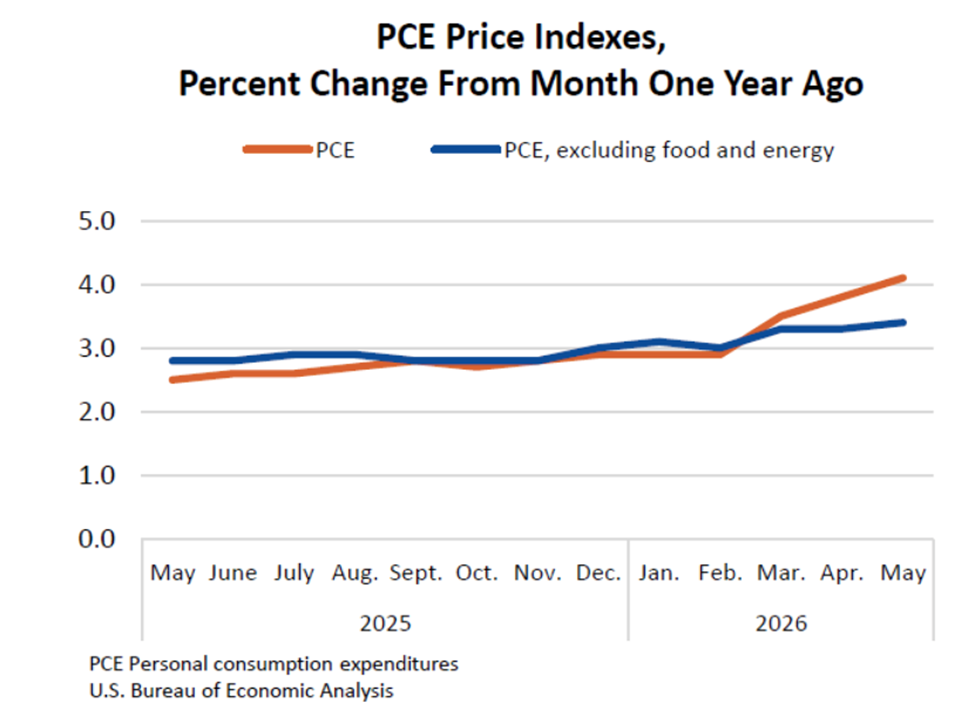
Perhaps the most important development for crypto investors is the resurgence of inflation concerns.
Recent Personal Consumption Expenditures (PCE) data—the Federal Reserve’s preferred inflation indicator—showed price pressures accelerating at the fastest pace since mid-2023. Both headline and core inflation measures remain well above the Fed’s target range.
This matters because inflation directly influences monetary policy.
For much of the past year, markets have priced in the possibility of lower interest rates and a more accommodative Federal Reserve. However, persistently elevated inflation reduces the likelihood of aggressive rate cuts and may force policymakers to maintain restrictive financial conditions for longer.
For Bitcoin, this creates a challenging environment.
The digital asset has increasingly behaved like a liquidity-driven investment. When central banks inject liquidity and borrowing costs fall, capital tends to flow toward speculative assets such as cryptocurrencies. Conversely, higher rates and tighter financial conditions often pressure valuations.
In other words, Bitcoin’s next major move may depend less on blockchain fundamentals and more on the direction of global monetary policy.
Why $60,000 Matters More Than Most Investors Realize
From a technical perspective, the $60,000 level carries both psychological and structural importance.
Psychologically, round-number price levels often become battlegrounds between buyers and sellers. Structurally, Bitcoin spent months building support in this region, meaning a sustained break below it could alter market sentiment significantly.
If bears successfully convert $60,000 into resistance, traders may begin targeting lower support zones, potentially accelerating downside volatility.
However, not all indicators point toward a bearish outcome.
Several analysts have identified early signs of bullish divergence on higher timeframes, suggesting that selling momentum may be weakening even as prices continue to decline. Such divergences have historically appeared near major market bottoms, although confirmation remains necessary before drawing definitive conclusions.
The 200-Week Moving Average Returns to Center Stage
Among long-term Bitcoin investors, few technical indicators command more respect than the 200-week Simple Moving Average.
Throughout Bitcoin’s history, this moving average has served as a key dividing line between bullish and bearish market cycles. Previous bear markets eventually found support near this level, while successful recoveries often required reclaiming it as support.
Currently positioned around $62,243, the 200-week moving average has become the market’s most important technical battleground.
A decisive move above this threshold would strengthen the argument that the recent sell-off is merely a correction within a broader bull cycle. Failure to reclaim it, however, could reinforce concerns that Bitcoin’s recovery remains incomplete.
Market Outlook: Correction or Opportunity?
Despite growing uncertainty, long-term investors may view the current environment differently from short-term traders.
Historically, periods of extreme fear have often created attractive accumulation opportunities for patient market participants. While macroeconomic headwinds remain significant, Bitcoin’s underlying fundamentals—including institutional adoption, expanding ETF participation, and continued scarcity following the latest halving cycle—remain intact.
The key question is whether macroeconomic pressures will continue to outweigh these bullish structural drivers.
For now, Bitcoin stands at a crossroads.
The coming weeks will likely determine whether the break below $60,000 represents the beginning of a deeper correction or simply another shakeout before the next phase of the bull market. With inflation fears resurfacing, technology stocks under pressure, and investors closely watching Federal Reserve policy, the battle for Bitcoin’s long-term trend has entered a decisive stage.